Hi, I’m Julia Stroud.

UX Research Leader · B2B SaaS · Developer Tools · PLG

I have 8+ years of experience leading strategic research and building the operational infrastructure that makes research scale. I specialize in discovery research, churn and retention analysis, and growth — partnering with Product, Design, Leadership, and GTM teams to turn ambiguous problems into decisions.

I work at the intersection of research rigor and emerging AI, including building custom AI-powered research tools that synthesize and surface complex datasets for stakeholders.

Julia Portfolio Assistant

AI-Powered Interactive Research Artifact

I created this tool to demonstrate how I translate complex survey data into layered, queryable insights — the same analytical approach I apply to mixed-methods research at Sonar. Built with Claude as a development partner using the 2024 State of Open Source Survey (n=2,046). Browse through the tabs to see key insights and cross-tab analyses, or use the AI Chat tab to ask your own questions of the data directly.

Findings from the 2024 State of Open Source Survey
UX Research Analysis · Open Source Survey

Findings from the 2024 State of Open Source Survey

Responses
2,046
Fielded
Oct–Nov '23
Published
2024
Source
Perforce / OpenLogic
95%
Maintained or grew OSS usage
Open source adoption is no longer a trend — it's a baseline. Only 5% reduced use, concentrated almost entirely in early-stage startups.
33%
Said usage increased significantly
One in three organizations made intentional expansions to their OSS footprint, even amid economic headwinds.
#1
Cost reduction — top driver, up from #9 in 2022
Economic pressure reshapes even deeply technical decisions. Cost overtook velocity and innovation in a single year.
OSS usage change over the past year
Insight: The 5% who reduced OSS are disproportionately early-stage startups — resource constraints, not strategic rejection. 39% of enterprises with 5,000+ employees reported a significant increase.
95% grew/maintained
Increased significantly33.5%
Increased27.0%
Remained the same34.1%
Reduced5.4%
Why organizations choose OSS
Insight: Talent retention ranks last at 6.1% — an underutilized framing in developer tool markets. Government orgs diverge sharply: 51.5% cited cost as their primary driver.
No license cost / cost reduction
36.6%
Improve dev velocity
30.7%
Stable community support
27.6%
Access to latest innovations
26.9%
Reduce vendor lock-in
21.3%
Open standards
20.9%
Modernize tech stack
20.0%
Easier hiring / retention
6.1%
OSS awareness gap: C-Suite vs. hands-on roles
Key finding
Insight: OSS adoption is routinely happening below executive visibility. This creates downstream misalignment in budgeting, risk tolerance, and open source policy — with direct implications for how developer tool vendors structure executive vs. practitioner conversations.
% saying OSS usage increased (any level)
Developer / Engineer
68.5%
Architect
66.1%
System Administrator
62.4%
Manager / Director
52.5%
C-Suite
40.0%
40% of C-Suite said usage "remained the same" — while 60%+ of engineers at those same companies reported increases.
Why this gap matters
Budget misalignment
Leaders who don't see OSS growth may underinvest in security tooling and compliance infrastructure that actual usage demands.
Risk exposure
Untracked OSS is a compliance and security liability — especially under the EU Cyber Resilience Act.
Product opportunity
Tools that surface OSS inventory to executives — not just engineers — address a genuine visibility gap this data reveals.
Top support challenges — overall
Insight: Security tops every segment (44% "very challenging"). Patch currency at 70% signals that OSS release velocity is itself a burden — continuous updates create maintenance overhead most teams can't absorb proactively.
Security / compliance
79%
Staying current w/ patches
70%
EOL / outdated software
65%
Skills / talent gaps
62%
Lack of commercial support
56%
Integration complexity
52%
License compliance risk
47%
Security challenge depth
Insight: The EU Cyber Resilience Act (effective 2027) will require formal SBOM documentation for all software with OSS components. With 79% already challenged here, compliance mandates will intensify this pressure substantially.
How challenging is OSS security / compliance?
All orgs
Very 44%
Somewhat 35%
Not 21%
Very challenging (44%)
Somewhat (35%)
Not challenging (21%)
Regulatory pressure ahead
EU Cyber Resilience Act (2027) requires SBOM documentation for all OSS-containing software. 79% of orgs already struggling means compliance mandates will significantly raise the stakes.
Top OSS adoption reason, segmented
Insight: Vendor lock-in reduction is significantly more important at enterprise scale (22% for 5,000+ vs. 15% for startups). Developer velocity dominates startup motivation — speed-to-market outweighs most other considerations.
Top adoption motivator mix by org size
Early-stage startup
Cost 28%
Velocity 35%
Innovation
Lock-in
Under 100
32%
31%
24%
13%
100–499
36%
30%
20%
14%
500–5,000
38%
29%
18%
15%
5,000+
34%
28%
16%
Lock-in 22%
Cost
Velocity
Innovation
Lock-in reduction
Insight: Government's 51.5% cost-first orientation diverges sharply from tech (30.5%). Cost framing may substantially outperform feature framing in public sector sales motions.
% citing "cost reduction" as #1 reason, by industry
Government / Public
51.5%
Nonprofit
46.2%
Education / Research
38.0%
Healthcare / Pharma
34.0%
Technology
30.5%
Banking / Finance
29.5%
Challenge severity heatmap
% rating each as "very challenging"
Insight: Security challenge severity scales with org size. Startups feel EOL and patch burden more acutely relative to security, suggesting resource constraints rather than awareness gaps as their limiting factor.
ChallengeStartup<100100–499500–5K5K+
Insight: Finance and healthcare show the highest security scores. Government scores high on EOL risk, likely reflecting legacy infrastructure that is politically and contractually difficult to retire.
ChallengeTechFinanceGov'tHealthEducation
Ask the data
Powered by Claude (Anthropic). Ask about adoption trends, segment comparisons, challenge patterns, or strategic implications.
AI
Hello! I have full context on the 2024 State of Open Source survey (n=2,046, Oct–Nov 2023). Ask me anything about adoption trends, segment differences, or developer tools strategy.

Past Work Case Studies


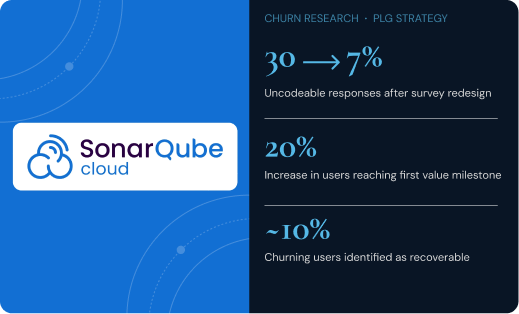
A longitudinal churn research program that transformed a broken data instrument into actionable PLG strategy.

Research to guide product, marketing, and sales strategies for the launch of a new service model.

A comprehensive analysis of lost sales opportunities to refine the sales funnel and boost client conversion.

Improving UX through a deep understanding of user satisfaction and product experiences